
 EN
 ES
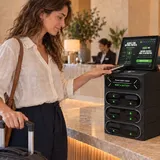
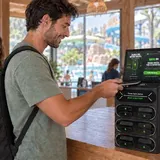
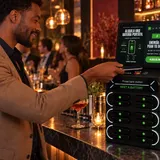
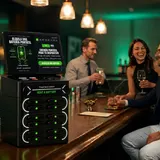

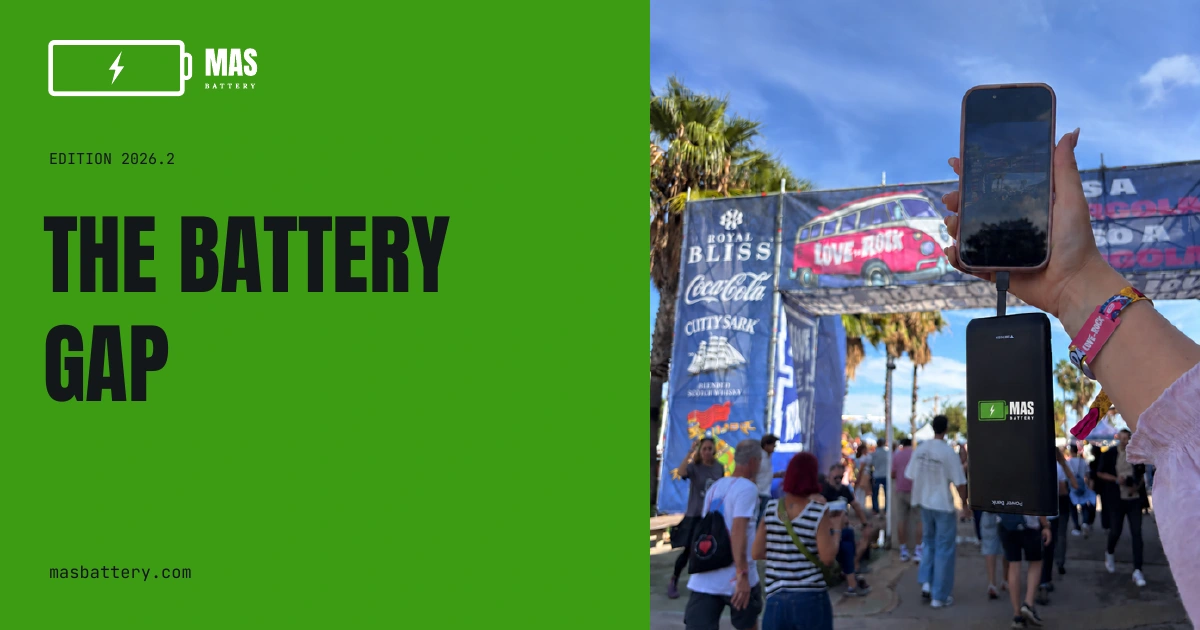
The battery gap is the difference between what a venue expects a guest's phone to do and the charge available to do it. Tickets, maps, messages, photographs and payments can all depend on the same device. This paper reviews public evidence and sets out a way to measure that dependency at your own venue, without turning a consumer survey into a rental forecast.
Download the full report as a PDF.
Summary
Venues have made the phone part of the visit. They have less control over the battery that supports it. Public surveys show that worry can begin well before a phone switches off, while tourism and event data show the scale of the activity in which phones are used. None of this tells an operator how many charging stations to install. That requires local evidence on visitors, groups, visit length, actual problems and willingness to use a service. The sensible response is to measure the gap, keep alternatives available and test a solution against the cost and work it introduces.
Four figures put the business context in view:
| Indicator | Public finding | What it does not establish |
|---|---|---|
| International arrivals in Spain | 96.8 million in 2025, up 3.2 % | Attendance at any particular venue |
| International tourist spending | €134,712 million in 2025, up 6.8 % | Money available to a charging service |
| Live music ticket revenue in Spain | More than €800 million in 2025 | Growth in audience headcount |
| Profitability as a hotel business priority | 84 % of respondents in a 2025 leadership survey | A return from installing charging |
Sources: INE FRONTUR, INE EGATUR, APM yearbook 2026 and Deloitte's hotel survey. The tourism releases identify their figures as provisional.
MasBattery sells a service in this category. That is a reason to be explicit about the limits of the argument. This paper contains no MasBattery rentals, usage, revenue, tariffs or customer results. The commercial mechanisms below are hypotheses to examine at a venue, not measured losses being assigned to all venues.
1. The venue moved the guest day onto the phone
The dependency rarely appears in a single investment proposal. A ticket becomes digital. A map becomes an app. Ordering moves to a screen. Guests coordinate their group through messages and record the visit on a camera that happens to be the same device. Each change may make sense by itself. Together they create a shared dependency that crosses several departments.
An admissions team can keep its own system working while a visitor cannot retrieve a ticket. A food outlet can keep accepting orders while a guest cannot open its menu. A map can be accurate while the person who needs it is avoiding screen use. System availability and guest access are different measures. A useful service review includes both.
There is evidence that the digital layer matters commercially. In its Chester Zoo case study, Attractions.io reports a 52 % increase in average transaction value and a 49 % year-on-year increase in app-driven food and beverage revenue after mobile ordering was introduced. These are vendor-published case-study results. They do not isolate battery effects, establish causality or predict the result at another attraction.
The narrower conclusion is useful enough: some venue services now carry meaningful transactions through a guest's phone. If access to that device becomes constrained, the operator should understand the fallback. It is not reasonable to multiply a vendor's uplift by the number of low-battery visitors and call the result lost revenue.
Nor does cashless mean phone-only. A physical contactless card may remain usable when a handset is flat. A printed ticket, a staffed information point and a visible meeting place can reduce dependence without any charging equipment. Before buying an additional service, map where the existing visit genuinely requires a working phone and where an alternative already exists.
Make that map across the full journey: arrival, admission, navigation, ordering, the main experience and departure. Assign an owner to each fallback. The point is not to undo digital services. It is to stop treating the guest's device as an unlimited resource outside the venue's responsibility.
2. The phone cannot be assumed to carry that load for a full day
Battery anxiety starts before the battery is empty
Three surveys give different worry thresholds. Uswitch and Opinium report an average of 18 % among 2,000 UK adults. Vodafone's June 2026 release gives 28 % in a commissioned UK survey. Talker Research gives 38 % among 2,000 US adults, rising to 44 % for Gen Z.
The surveys disagree on the number. They agree that concern can begin long before zero. They use different populations, wording and dates. Their results should sit beside each other with those labels attached. They should not be averaged into a universal threshold or used to mark the moment every guest changes behaviour.
Talker's fieldwork ran from 31 January to 3 February 2025. Its release was published on 8 April. Uswitch's public methodology prints an unusual fieldwork date range spanning September 2024 to September 2025. We retain the stated sample and publication year but do not silently repair that range. Vodafone commissioned its research while promoting a service promise. Those details affect how confidently the results can be transferred.
The age-specific findings also need their denominator. In the Uswitch survey, 14 % of people aged 18 to 34 had chosen a meetup setting based on charging facilities, while 32 % had bought a charger or power bank while out to avoid a dead phone. Those are UK young-adult findings, not shares of all adults, Spanish visitors or festival attendees.
A battery percentage is not a clock
The same remaining charge can last very different lengths of time depending on the device, battery condition, screen use and activity. A guest may arrive with a nearly full battery after a short journey, or already be conserving it after hours of travel. A full-day event does not begin at the venue gate for the person attending it.
Photography, navigation, messaging and ordering add to that workload. How much they add at a particular site is not established here. We do not offer a universal drain rate, an hour when phones fail or a promise that one charge covers every handset.
The operational question is when a guest starts changing plans or asking for help. Measure that point directly. Requests at reception, the timing of charging enquiries and an exit question are more relevant to deployment than a national average worry percentage. Also ask whether the guest already carries a power bank. Concern and unmet demand are not the same thing.
3. Spain: the demand is already in the venues
Tourism provides scale, not a conversion rate
INE's full-year 2025 FRONTUR release records 96.8 million international tourists, up 3.2 %. EGATUR records €134,712 million of international tourist spending, up 6.8 %. They describe a large visitor economy in which navigation, travel documents, communications and venue visits often overlap. They do not describe a pool of customers that a charging operator can claim.
A tourist arrival is not a unique person visiting your venue. Tourist spending includes categories beyond attractions and events. These series must not be multiplied by a battery-anxiety percentage to estimate charging revenue. Their role in this paper is context for venue decisions, not a shortcut around local demand measurement.
Live music revenue has grown
The APM yearbook series gives approximately €579 million in ticket revenue in 2023, €725.6 million in 2024 and more than €800 million in 2025. The supplied yearbook figures describe increases of about 25 % in 2024 and 11.2 % in 2025. The 2026 publication reports the latest annual record.
Revenue growth is not the same as growth in attendance. Ticket prices, event mix and the scale of individual productions can affect the total. The practical planning implication is to examine your own event calendar and visitor hours, rather than assume that national revenue growth means a proportionate rise in charging demand.
Events can motivate a journey
SiteMinder's Changing Traveller Report 2026 surveyed 12,000 travellers in 14 countries, including Spain. Its November 2025 release says 63 % were more likely to travel for special events the following year, with figures of 81 % for Gen Z and 74 % for Millennials. The following year means 2026. It is not a forecast of intentions for 2027.
This is a survey about intentions, not completed journeys or charging purchases. It still gives operators a useful planning question: how much of the guest day happens before arrival and after departure? Transport connections, accommodation and the return journey may matter as much as hours inside the event.
A calendar creates repeat operational needs
IFEMA Madrid's 2024 results report 740 events and 4.06 million visitors. The release describes an institutional activity programme and also mentions fairs outside Spain. We use its annual totals as reported, without treating them as the activity of one physical building.
Deloitte's 2026 sports outlook describes sports districts active beyond match days. This is a strategic trend analysis, not a count of venues already operating that way. For a site with a busy calendar, the useful question is whether charging should be planned as a continuous guest service, with placement and responsibilities that survive a change of promoter.
4. What venue operators are dealing with
Profitability and staffing shape the decision
Deloitte's 2025 European Hotel Industry and Investment Survey collected responses from 100 senior hospitality figures, including owners, lenders, developers and investors. Fieldwork ran from 6 August to 26 September 2025. Managing or increasing profitability was a business priority for 84 %. Labour and workforce challenges were a growth threat for 83 %, geopolitical tension for 78 %. Only 47 % expected hotels to be more profitable in five years.
These are the views of the surveyed leaders, not the responses of every European hotel manager. They explain why a guest-service proposal has to include work as well as benefits. Who checks equipment? Who handles complaints? Who explains a return problem? A service that adds repeated small tasks can become an operational cost even if the supplier installs it.
The available STR and Tourism Economics forecast, reproduced by Hotel Online, puts European RevPAR growth at 1.2 % for 2026 and a decline of 0.1 % for 2027, using the August edition. This is a forecast reported in trade press, not an observed result or a Spain-specific forecast. We did not access the original forecast publication and do not use these figures in the demand model.
Guests want the visit, not another process
Accenture's Life Trends 2025 release describes an impatience economy in which more than half prefer quick answers and guidance. It also reports that 42 % attributed their most enjoyable experience of the previous week to something physical, compared with 15 % to something digital. Its validation survey covered 24,295 people in 22 countries in July 2024.
These findings concern broad attitudes. They do not prove that removing a registration step raises charging use by any particular amount. They do suggest a sensible design test: can a guest understand the service, its terms and its return process at the moment they need it? A short interaction can still be clear and accountable. Fewer steps are useful only when they remove work rather than hide information.
5. Five channels where the gap may reach the P&L
Ordering and basket value
When a phone supports ordering, a visitor who avoids using it may switch to a till, ask someone else to order or abandon the purchase. Those outcomes have different commercial effects. Measure completed orders and contribution, not just app activity. The Chester Zoo case study demonstrates the potential importance of a digital ordering channel; it does not quantify the effect of a low battery on that channel.
Payment completion
A guest using a mobile wallet may have a card or another member of the group available. The venue should test what happens when the preferred method is unavailable, and whether staff can explain the alternative. A payment problem may be attributable to connectivity, terminal availability or the account rather than charge. Record the reason before assigning a lost sale to a battery.
Visit length and the quality of departure
A group unable to communicate may decide to reunite or leave. That is a plausible mechanism, not a measured universal effect. A shorter visit is not automatically a worse visit, either. The relevant question is whether the day ended as intended. An exit survey can distinguish a planned departure from one prompted by an avoidable service problem.
Photographs, reviews and recommendations
A constrained phone may change how a guest records or shares an experience. But fewer photographs cannot be converted directly into lost marketing value. People may also choose to spend less time on screens. Review comments can identify a service issue, while a structured question can test how common it is. Neither should be stretched into a revenue estimate without further evidence.
Staff time
Requests to borrow a cable, leave a phone behind reception or solve a charging problem can consume time. Log the request, the action and the minutes involved. Avoid collecting personal phone contents or unnecessary identifiers. A replacement service earns credit for work it demonstrably removes, after accounting for checks, guest questions, faults and the supplier coordination it introduces.
Do not add all five channels together without checking overlap. A guest who cannot order and then leaves may otherwise be counted as both an abandoned basket and a shortened visit. The objective is to understand a real operational problem, not to build the largest possible total.
6. Sizing it at your venue: the five-input model
Use consistent units. The model starts with visiting groups because the original question asks whether anyone in a group had a problem. If annual attendance counts individual visits, convert it using the venue's measured average group size. That conversion is a required input to the calculation, even though the model retains the five named variables below.
| Input | Definition | Evidence needed |
|---|---|---|
| A | Annual individual visits | Venue attendance records |
| B | Share of visiting groups with at least one phone below its user's worry threshold before departure | A local measurement |
| C | Share of those groups whose spending or behaviour changes because of it | A follow-up question or observed evidence |
| D | Average spend forgone per affected group | Venue evidence, distinct from contribution |
| E | Share of affected groups willing to use an accessible charging service | A local test of the actual service |
Let G be average visiting group size. Visiting groups = A ÷ G. Potential spending exposure = (A ÷ G) × B × C × D. The output is revenue exposure, not profit, guaranteed recovery or charging revenue. Apply an appropriate contribution margin only if you have measured one for the relevant spending.
Define E carefully. If it refers to all battery-concerned groups, potential user groups = (A ÷ G) × B × E. If it is measured only among the groups counted in C, use (A ÷ G) × B × C × E instead. State which population you used. Neither result is a rental count: more than one phone may need help, people may use alternatives and equipment can turn over during the day.
Three inexpensive ways to investigate B
Ask at exit. Ask whether the guest or anyone in the group worried about their phone battery during the visit. Record whether it changed anything and whether an existing solution was used. Cover different event types, visit lengths and departure times. Two weekends can start the work; they do not guarantee a representative sample. Report response counts, the sampling method and who was missed.
Review app use by hour. Compare sessions with the attendance curve. A decline can suggest a question to investigate, but it does not identify battery loss. Ride schedules, weak connectivity, fatigue and deliberate screen avoidance can all affect use. Use aggregate information appropriately and treat telemetry as a signal, not a substitute for the exit question.
Compare till and app mix. A changing mix can reveal a service issue worth checking. It can also reflect menu differences, opening hours, queue lengths or promotion. Ask staff what happened and compare similar periods. The original edition treated these signals too confidently. They are diagnostic leads, not direct measurements of the share of groups with battery concern.
Turn a demand estimate into a service test
Map likely pickup and return points, the busiest periods and the closing wave. Test accessibility, signage, available power and staff responsibilities. Count successful returns as well as take-outs. A station that serves demand at the start but cannot accept returns at the end has not passed the service test.
Set success criteria before installation. Include guest understanding, availability, response to faults and staff time alongside use. Keep the no-install option in the comparison. If unmet need is low, better information about existing sockets or a clearer fallback may be the right answer.
7. The four answers, and what each actually solves
Fixed sockets and charging tables
These let a guest charge a device in a known place. They can suit a seated part of the visit or an emergency fallback. Depending on the arrangement, guests may need their own cable, wait for a place or stay near the phone. Consider access, cable condition, supervision and how the charging area affects circulation. A well-located fixed point can be sufficient where measured demand is occasional.
Lockers with charging inside
These combine storage and charging. They can make sense when a visitor wants to put a phone away. They also separate the guest from tickets, messages and the camera while the phone is inside. Evaluate storage and charging as distinct needs. Confirm access, capacity, recovery from a failed lock and what happens when a guest needs the phone before it is charged.
Sell-a-battery kiosks
These provide portable power through a purchase, sometimes with a swap arrangement. The guest can continue moving with the device. They also have to understand ownership, compatibility and any later exchange conditions. Assess whether the product solves the immediate need and whether its ongoing use fits the venue. Do not assume the purchase model is unsuitable simply because the need arose unexpectedly.
Rent-and-return networks
These provide portable power for a period without requiring ownership. Their usefulness depends on availability at pickup, a clear process and a practical return. Assess return capacity, walking routes, opening times, maintenance and what happens when a guest leaves through a different exit. A network diagram is more informative than a count of machines alone.
Our own disclosure
MasBattery installs power bank rental stations at venues and events in Spain. Guests pay by card at the station, take a charged power bank with exactly two built-in cables, USB-C and Lightning, and return it at any MasBattery station. No app or sign-up is required.
This category still needs a suitable powered location, maintenance and enough return capacity. MasBattery stations are placed indoors or under cover. A service can be inconvenient if the return requires an unnecessary detour, or fail operationally if nobody owns a fault. These limitations belong in the buying decision. The category is appropriate only where it performs better than the available alternatives under the venue's actual conditions.
8. Four reports, four market sizes?
We reviewed four leads: LP Information, Verified Market Research, Coherent Market Insights and QYResearch. They use different report titles, years and market definitions. The LP listing concerns rental stations, while other titles refer to sharing services or shared power banks. Treating them as repeated measurements of one identical market would be misleading.
Two original publisher pages could be confirmed: Verified Market Research states USD 1.50 billion in 2025 and USD 4.76 billion in 2033. Coherent Market Insights states USD 1.80 billion in 2026 and USD 4.94 billion in 2033. These are commercial research estimates and forecasts, not official statistics.
The LP original page did not return usable content during our check. The QY figure was visible on a reseller's page, but its original publisher page was not confirmed. Under this edition's verification rule, their values are omitted. The missing values are not zeros and should not be plotted as such. This is why the heading is a question rather than a claim that four comparable sizes have been established.
Do not trust any market-size slide as a venue business case, ours included. A global total does not tell you who visits your site, whether they need charging, what they already carry or whether a return point will be convenient. An honest local measurement is more useful than choosing the largest forecast.
9. Twelve questions before you deploy anything
1. How many return points, and what is the walk?
Map the route from where people finish using a device to where they can return it. Check the actual guest route, access restrictions and closing times. A short straight-line distance may still be an awkward walk.
2. What happens near closing?
Ask how return capacity is protected during the departure wave. Identify who responds when a station is full and what the guest should do. Test that answer before the busiest day.
3. Who takes payment and handles a dispute?
Get the responsible business, the payment path and the complaint process in writing. Make the guest-facing explanation consistent with the agreement. Unclear responsibility is an operational problem before it becomes a financial one.
4. Which languages and accessibility needs are supported?
Try the real interface with the visitor groups the venue serves. Review visibility, reach, instructions and the route to human help. A list of languages in a brochure is not a usability test.
5. What operational data will the venue receive?
Ask for useful aggregate reporting by location and time, with definitions and export options. Distinguish completed transactions from attempts and faults. Collect only information needed to run and evaluate the service.
6. Can you show the applicable product safety documents?
Ask for the actual documents for the offered models and batteries, with the responsible entities identified. Have a qualified reviewer determine what applies to the installation and market. A generic logo or a file for a different model is not enough.
7. Who is responsible for registration, collection and end-of-life handling?
Have the supplier identify the relevant responsibilities and provide evidence where applicable. Check what happens to damaged equipment and batteries. This is a verification question, not a claim that this paper establishes legal compliance.
8. Who answers a guest who has a problem at 22:00 on a Saturday?
The real test of a service is the evening and the weekend, not office hours. Ask for a working contact route, an expected response and a clear division between the supplier's task and the venue's task.
9. What are the installation conditions?
Request the manufacturer's operating limits, the power requirements and the location review. Confirm protection, access and maintenance conditions for the actual site. Do not accept an attractive mockup as an installation assessment.
10. How much staff time does it consume?
Ask for named tasks and minutes, including the less frequent problems. During the pilot, record what staff actually do. Include training, cleaning, escalation and rebalancing where relevant.
11. What are the removal and exit terms?
Agree the decision point, responsibilities and process before deployment. Identify how equipment, open guest issues and any site works are handled. A pilot should produce a decision rather than an indefinite obligation.
12. What changes when the service scales?
Ask how maintenance, stock, returns, support and reporting work across the proposed estate. Test the busiest plausible operating condition. A successful demonstration does not establish performance across a whole calendar.
10. Method and sources
This edition is desk research checked on 24 October 2026. Sources were read at the publisher where accessible; exceptions are identified below. Survey results are self-reported, case studies are vendor-selected and market forecasts are commercial estimates. None measures MasBattery's performance. Recommendations and the five-input model are this paper's analysis.
| Source and date | Type | Use and limitation |
|---|---|---|
| INE FRONTUR, 3 February 2026 | Official | 2025 international arrivals; provisional release |
| INE EGATUR, 3 February 2026 | Official | 2025 international spending; provisional release |
| Uswitch and Opinium, 13 October 2025 | Commissioned survey | UK sample; age-specific behaviours; printed fieldwork dates require caution |
| Vodafone, 16 June 2026 | Commissioned survey | UK worry threshold; commercially interested commissioner |
| Talker Research, 8 April 2025 | Survey | US sample; January and February fieldwork |
| APM yearbook 2026, March 2026 | Industry body | Ticket revenue series, not audience counts |
| SiteMinder, 19 November 2025 | Commissioned survey | Travel intentions for 2026, not 2027 |
| IFEMA Madrid, 28 April 2025 | Venue publisher | Institutional annual activity totals |
| Deloitte sports outlook, February 2026 | Industry analysis | Strategic direction, not a venue census |
| Deloitte hotel survey, 20 November 2025 | Survey | 100 senior hospitality figures; 2025 responses |
| STR and Tourism Economics via Hotel Online, 6 October 2026 | Press | August forecast; original publication not accessed |
| Accenture, 16 October 2024 | Survey | Life Trends 2025; fieldwork July 2024 |
| Attractions.io, October 2025 | Vendor case study | Chester Zoo digital ordering results; no battery effect established |
| Verified Market Research, checked October 2026 | Commercial research | Published estimate and forecast; methodology not audited here |
| Coherent Market Insights, 31 March 2026 | Commercial research | Published estimate and forecast; scope differs from other titles |
The earlier edition's unconfirmed technical ratios, spending margins and anecdotal guest accounts have not been carried forward. Missing evidence is not evidence of absence. If you think a retained figure is wrong, identify the figure, the source and the reason. A correction is more useful than a confident repetition.
FAQ
At what battery level do people start to worry?
The reviewed surveys report averages of 18 %, 28 % and 38 % in different UK and US samples. They are not interchangeable thresholds. A venue should ask its own guests when concern begins and whether it changes their visit.
Do guests choose venues based on phone charging?
In the Uswitch survey, 14 % of UK respondents aged 18 to 34 reported choosing a meetup setting based on charging facilities. That does not establish the rate among Spanish venue visitors. It is a reason to test the question locally.
How do I estimate charging demand at my venue?
Start with attendance, visiting group size, battery concern and existing alternatives. Measure willingness to use the actual service separately from concern. Then test placement, availability and returns before turning the estimate into equipment quantities.
What are the options for phone charging at a venue?
The four broad categories are fixed charging, charging lockers, battery sales and rent-and-return services. They solve different combinations of mobility, storage and access. The appropriate choice depends on the visit and the work each option creates.
How big is the power bank rental market?
The reviewed commercial reports use different dates and definitions, and only two original publisher values were confirmed. A global estimate is not a forecast for a particular venue. Use local evidence to make a deployment decision.
What should I ask a charging supplier?
Ask about pickup and return capacity, payments, support, operating conditions and staff work. Request the applicable product documents and clear removal terms. Test what happens near closing and outside office hours.